Light counts people only in the dark
November 2026
November 2026
Above the Rift Valley, Kenya
In February, Kim Jong Un opened the last of 50,000 new flats in Pyongyang.1 From space, new blocks show up as roofs by day and as light by night. Over the past two decades the light over Pyongyang has climbed far faster than the official count of the city's people. The United Nations carries the official count forward from North Korea's last census, taken in 2008. Either Pyongyang holds people the official count has missed, or the city's light measures something other than people.
The answer matters beyond Pyongyang, because satellites now help decide how many people a city holds. In November 2025 the United Nations began drawing the world's cities from satellite pictures.2 Economists, World Data Lab's among them, have read North Korea's income from night light, assuming light follows people and money.3 Across 558 large cities, light follows the official count only where a city is too dim to fill the satellite's sensor. Even there, light counts people across many cities at once, not one city at a time.
Light, rooftops and the official count had to share one outline for each city. Each of the 1,860 cities on the UN's list was matched to the built-up area drawn around it from satellite pictures. The light inside each outline was then added up for 2000 and 2020. The sample is the 558 areas with an official count of a million or more that already showed light in 2000.
N'Djamena, the capital of Chad, is among the darkest of the 558. Between 2000 and 2020 the official count of N'Djamena roughly doubled. The light inside the city's outline more than tripled over the same years. Most new light fell on roofs already standing.
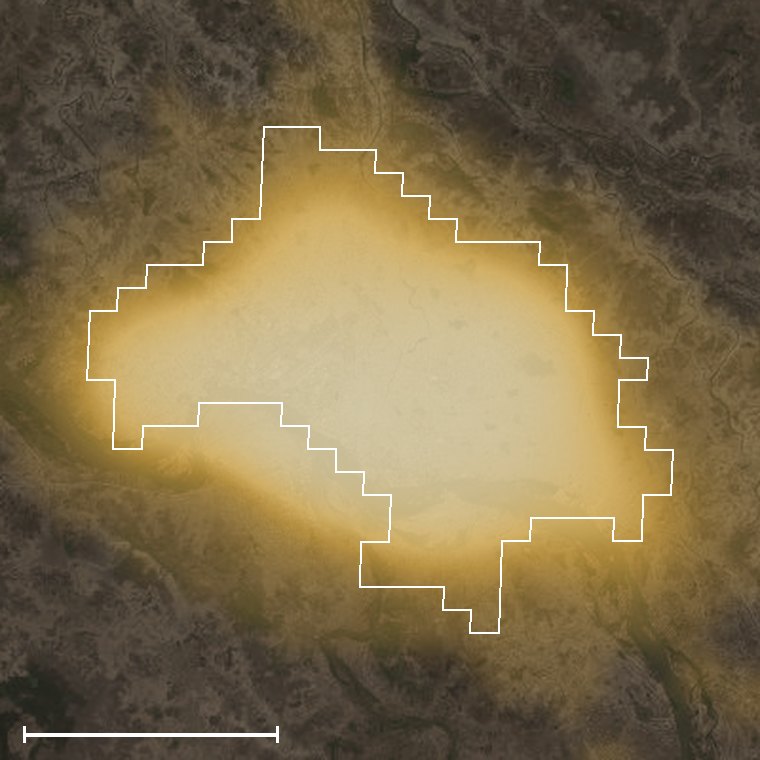 2020
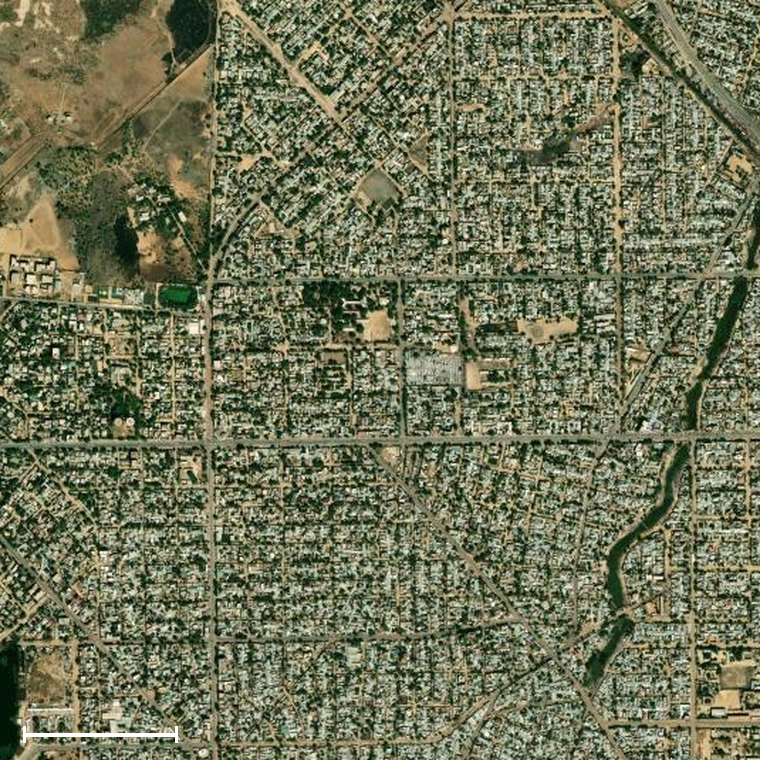
N'Djamena, Chad. Night light inside the built-up outline, 2000 and 2020, with a rooftop close-up. Growth, 2000 to 2020: official count +106%, rooftops +28%, light +230%.
The satellite's sensor records no more brightness once a patch of city passes a certain level. The 558 cities were sorted by how much of their light hit that ceiling. Where little or none did, light grew about 7 points for every 10 points of growth in the official count. Where more than a third sat at the ceiling, light grew only one and a half points for every 10. The split holds in each decade on its own.
Points of light growth for every point of growth in the official count, 2000 to 2020, with all the cities in each group added together. Cities are grouped by the share of their light at the sensor's ceiling.
The seven-tenths pace belongs to many cities added together, because single cities grow in different ways. Each city was sorted into one of six kinds by how its three measures moved. The commonest kind, 234 of the 558, filled in, with people arriving faster than new roofs or light. Another 51, almost all among the darkest, lit up, with each roof shining much brighter. In a city that lit up, the light tells of power more than of people.
Each square is one of the 558 cities, grouped by how its official count, rooftops and light grew from 2000 to 2020.
Power moves a dark city's light more than building does. Light can rise because a city builds more or because its roofs shine brighter. Each city's light growth was split into those two parts. Among the darkest quarter of cities, brighter roofs accounted for three-quarters of the differences in light growth. New building accounted for only a quarter.
The 140 cities darkest in 2000. Each city's light growth, 2000 to 2020, split into the part from more roofs and the part from more light on each roof.
Where power arrived after war, the light ran far ahead of the official count. Kabul and Mogadishu, the two dark cities whose roofs brightened most, both emerged from war over these years. Mogadishu's light grew more than four times as fast as the city's official count.
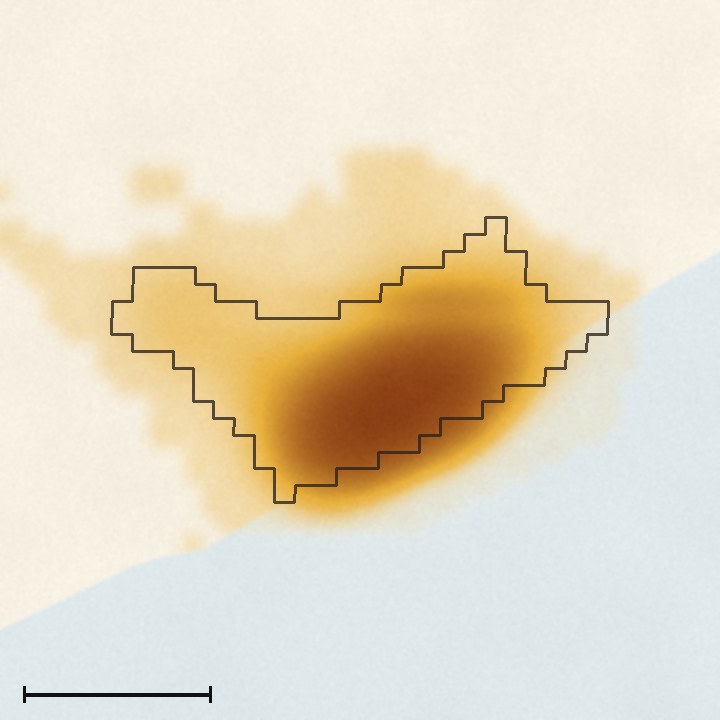 2020
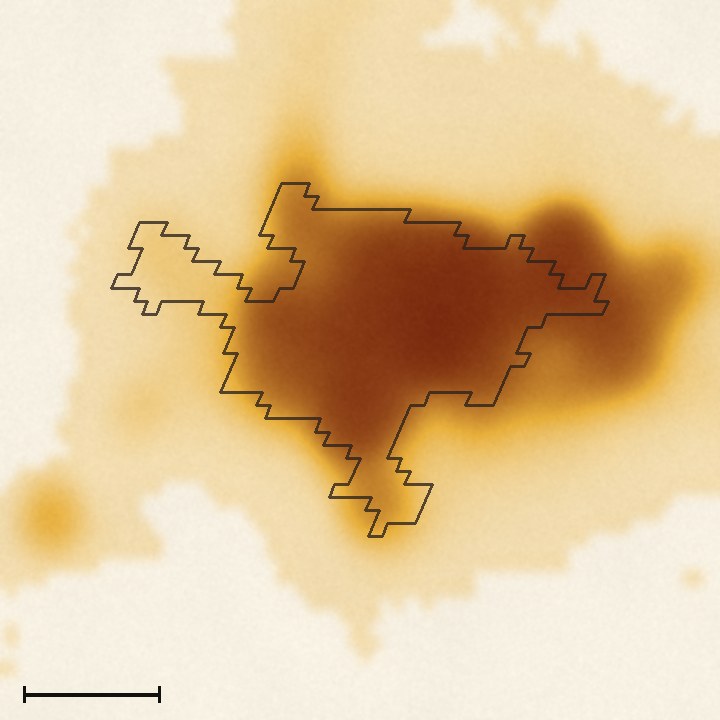 2020
Night light, 2000 to 2024. Gold is light. The black line is the edge of the built-up area and the bar is 10 km. Panel figures are growth from 2000 to 2020.
Where war or neglect cut the power, the light fell even as the official count climbed. In Mbuji-Mayi, in the Democratic Republic of the Congo, the official count rose 150% while the light fell by two-fifths. Sana'a's light dimmed in the same way through Yemen's war. The official count in Mbuji-Mayi rests on a census from 1984. Telling failing power from a stale count takes a second signal.
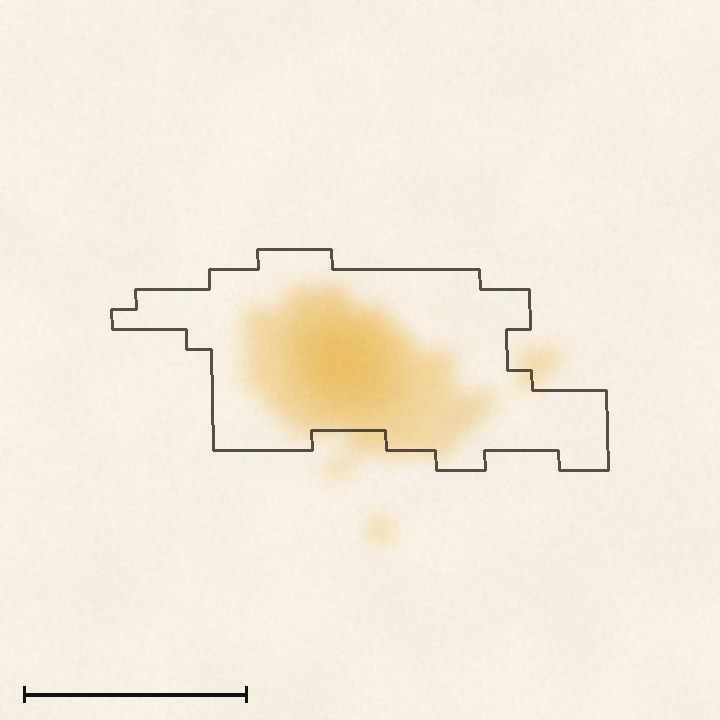 2020
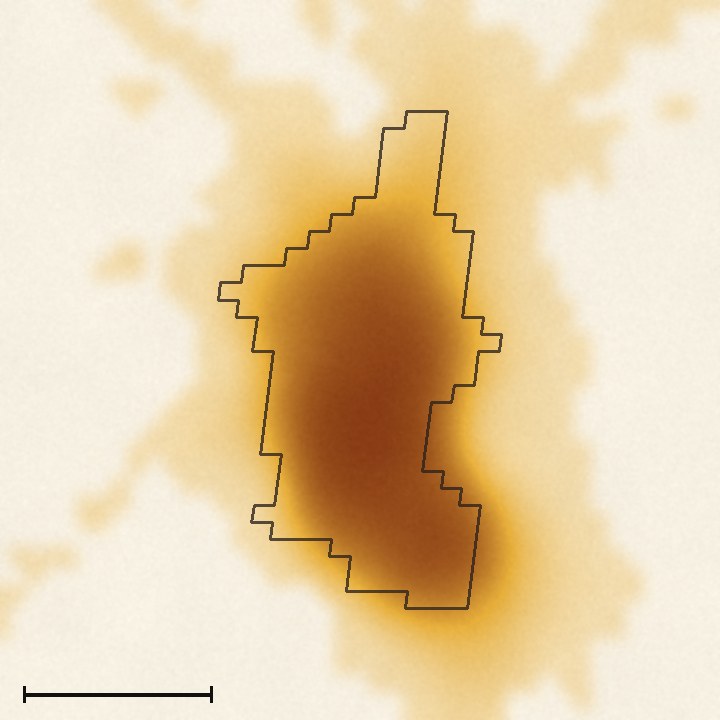 2020
Night light, 2000 to 2024. Gold is light. The black line is the edge of the built-up area and the bar is 10 km. Panel figures are growth from 2000 to 2020.
| Region | Cities | Both ahead | Which cities |
|---|---|---|---|
| China | 127 | 7 | Fushun, Fuyang, Jining, Linyi, Taian, Wuhan, Yancheng |
| India | 62 | 1 | Hubli-Dharwad |
| Everywhere else | 316 | 2 | Odesa, Phnom Penh |
| Sub-Saharan Africa | 53 | 0 | None |
| All | 558 | 10 |
Cities of a million people or more whose rooftops and light both grew at least 20 points faster than the official count, 2000 to 2020.
Official counts: United Nations, World Urbanization Prospects 2018, urban agglomerations of 300,000 people or more. The 2020 figures are UN projections from each country's last census (2008 in North Korea, 1984 in the Democratic Republic of the Congo). Built-up areas and rooftops: European Commission, GHSL Urban Centre Database R2024A. Rooftops are the land under buildings. Each official city is placed in the built-up area around it (inside or within 10 km), with the official figures of all cities in one area added together. Night lights: Li, Zhou and others, harmonised DMSP and VIIRS night-time lights, 1992 to 2024, in cells of about 1 km. The series joins two satellites, converting the newer one's readings to the older scale after 2013. Light is the summed brightness inside each built-up outline. The large cities are the 558 built-up areas with an official count of a million or more in 2020 that were lit in 2000. Ceiling: a cell at the sensor's top reading (62 or more); a city's share is the higher of its 2000 and 2020 shares. In the ceiling chart, growth is summed over all cities in each group; the decade check splits 2000-10 (one sensor) from 2010-20. The six kinds, applied in order: went dark (light fell more than 10%); lit up (light per unit of built-up land rose 40% or more); counted but not seen (official count up 75% or more, rooftops and light each under 20%); settled (official count and rooftops each under 25%); spread out (rooftops kept within 15% of people); filled in (the rest). The roof split divides each city's light growth into growth in rooftops and growth in light per unit of rooftop, and measures how much of the spread between cities each part carries. The darkest quarter ranks the cities by light per square kilometre in 2000. Both ahead means rooftop growth and light growth each exceeded official count growth. Coastlines from Natural Earth.
1. The Korea Times, citing KCNA, on the completion of the 50,000-flat Pyongyang housing project (the last 10,000 in Hwasong district), 17 February 2026. https://www.koreatimes.co.kr/foreignaffairs/northkorea/20260217/n-korea-completes-50000-unit-housing-construction-project-in-pyongyang-kcna
2. UN DESA, World Urbanization Prospects 2025, press release, New York, 18 November 2025. https://www.un.org/sustainabledevelopment/blog/2025/11/press-release-wup2025/
3. Crespo Cuaresma, Danylo, Fritz, Hofer, Kharas and Laso Bayas, "What do we know about poverty in North Korea?", Palgrave Communications (Nature Portfolio) 6, 40 (2020). https://doi.org/10.1057/s41599-020-0417-4. The paper estimates income per head from VIIRS night light, 2012 to 2018, using the link between light and income found across Chinese prefectures; North Korea's regions fall in the lower part of the Chinese range (p.5). Population comes from North Korea's 2008 census, carried forward at the national growth rate (p.5). The paper puts extreme poverty (under $1.90 a day) at around 60% in 2018.